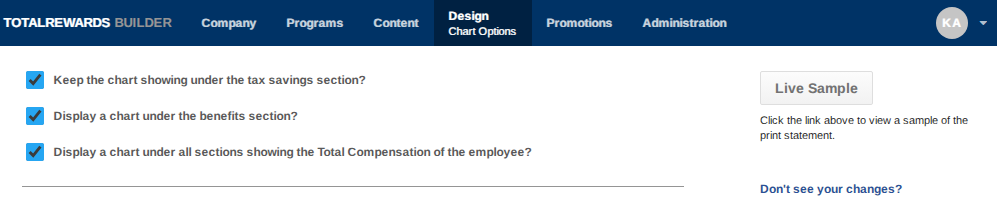
Chart Options are typically left enabled to provide visual representation of data within the statement.
For the two-page PDF print version, the chart under the Estimated Tax Savings section is automatically removed.
📐 Customize Chart:
- Go to Design.
- Select Chart Options from the dropdown.
- To control chart visibility, simply uncheck the corresponding boxes.
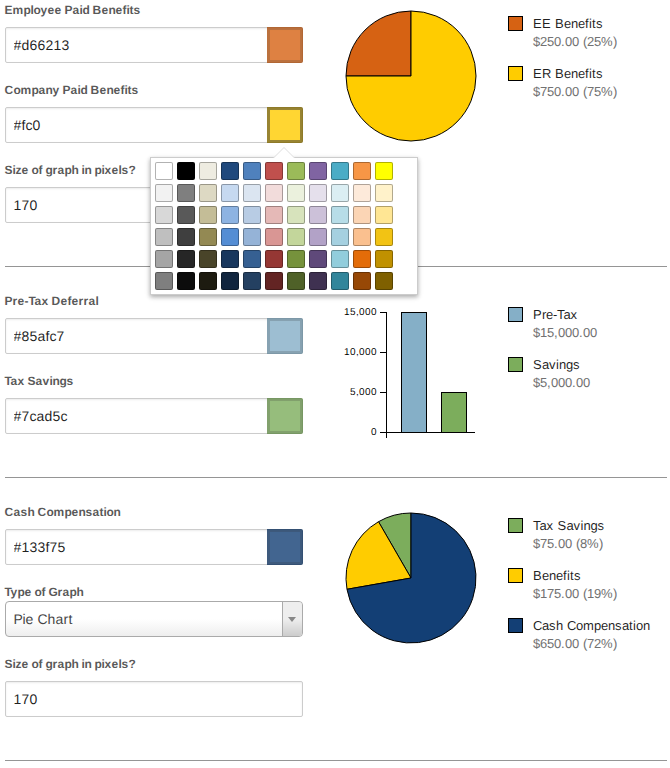
- Enter HTML color codes directly in the color fields.
- Or click the color squares to select from the palette.
- Adjust graph size if necessary.
- Modify the number of decimal places shown in percentage values.
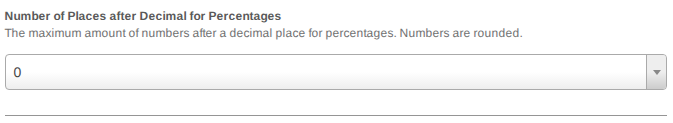
- Changes will take effect after you click Save.


📌 Note: Use brand-specific colors to maintain consistency with your organization's visual identity.
⏩ Quick Steps: Design → Chart Options → Charts Visibility → Colors → Graph Size → Decimal Places → Save